Visualisation of the extracted root system with visualea
Ploting comparative histogram
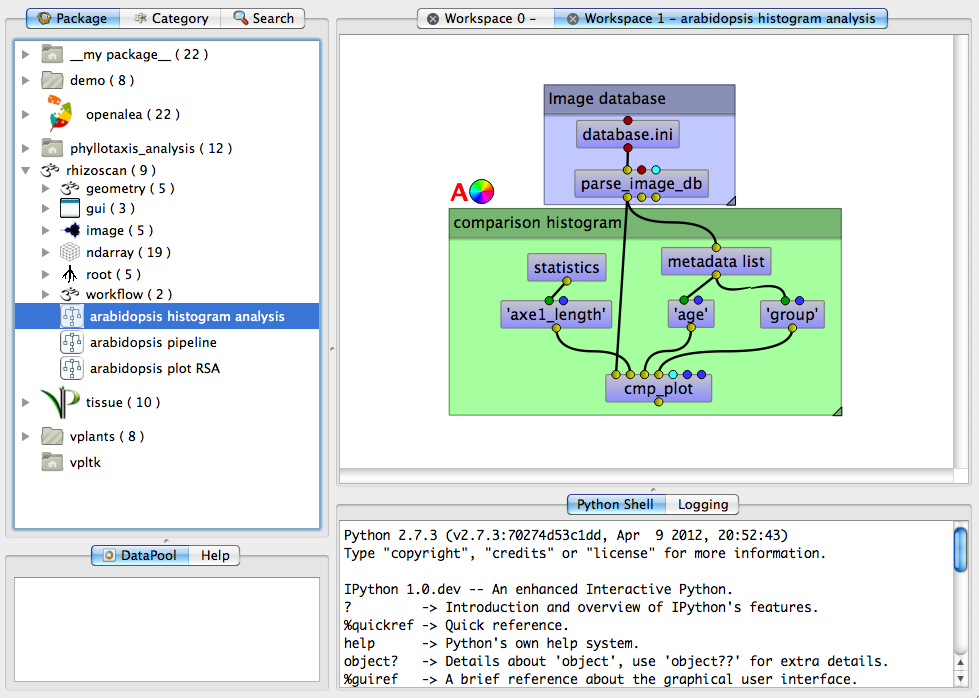
The rhizoscan package provide a simple tool to compare measured root system visually: open the dataflow arabidopsis histogram analysis at the bottom of the rhizoscan package:
- This dataflow as two parts:
- The upper part is the database loader: select the database file using the top modules (named databse.ini)
- The second part provide the plotting tools: - the module cmp_plot do the plot. To start it right click on it and select run. The plot is done with respect to three main inputs - the one on the left (axe1_length in the example) is the measurement to plot. Double click on the module to open the selection interface. - The center one (age) indicates the metadata name that contains the